


This repository provides a reproducible, archival-quality pipeline to download, validate, transform, and document weekly shapefiles from the US Drought Monitor (USDM). Both USDM geometry products are archived: the clipped (masked) shapefiles that make up the published USDM map, and the unclipped generalized shapefiles as drawn by the USDM authors (see Two geometry products). The archive is structured using the BagIt 1.0 specification and includes:
- Raw weekly shapefiles (clipped and unclipped) and text summaries
- Cleaned, validated spatial data in GeoParquet format for both products
- Per-week ISO 19115-1 metadata in XML
- Geometry validation and raw-file provenance logs
- Weekly updating and manifest tracking
📂 View the US Drought Monitor archive listing here.
The goal of this repository is to draft a regulatory-grade archive of the US Drought Monitor that conforms with the Foundations for Evidence-Based Policymaking Act of 2018 (“Evidence Act”, Public Law 115–435), the Geospatial Data Act of 2018 (enacted as part of Public Law 115–254), and Executive Order 14303, Restoring Gold Standard Science. Given the regulatory role played by the USDM (e.g., 7 CFR 1416.205, 7 CFR 759.5), it is essential that an authoritative, well-documented, persistent, and findable archive of the USDM be established by a Federal agency. This work seeks to create a framework for such an archive.
📈 About the US Drought Monitor (USDM)
The US Drought Monitor is a weekly map-based product that synthesizes multiple drought indicators into a single national assessment. It is produced by:
- National Drought Mitigation Center (NDMC)
- US Department of Agriculture (USDA)
- National Oceanic and Atmospheric Administration (NOAA)
Each weekly map represents a combination of data analysis and expert interpretation.
Note: This archive is maintained by the Montana Climate Office, but all analytical authorship of the USDM drought maps belongs to the named USDM authors.
Two geometry products
NDMC distributes each weekly map in two spatial forms, and this archive preserves both with identical processing:
- Clipped (masked) — the drought polygons masked to the US coastline
and territorial boundaries, as distributed in NDMC’s “M”
shapefiles
(
USDM_YYYYMMDD_M.zip). This is the geometry shown on the published USDM map, and is whatdata/raw/,data/parquet/, anddata/metadata/contain. - Unclipped — the generalized drought-class polygons as delineated
by the USDM authors, not masked to shorelines or boundaries
(polygons extend beyond the coast). NDMC posts recent weeks at the
shapefiles_rroot and older weeks in theshapefiles_rArchive (usdm_YYYYMMDD.zip, one shapefile per drought class,Drought_Areas_US_D0–D4). These are archived indata/raw_unclipped/,data/parquet_unclipped/, anddata/metadata_unclipped/, and are useful for custom masking, coastal analyses, and overlays with boundary data that differ from NDMC’s mask.
The drought classification is identical between the two products — only
the coastal/boundary masking and the way classes are represented differ.
Unclipped raw zips are archived byte-for-byte under their verbatim
upstream filenames (the NDMC listings mix usdm_/USDM_ case); each
file’s source URL, upstream modification time, and size are recorded in
data/quality/raw_unclipped_sources.csv.
The two GeoParquet products share one schema (date, usdm_class) but
represent classes differently:
- Clipped: mutually exclusive classes. Each polygon’s
usdm_classis the drought class at that location; the D0–D4 features tile the map without overlap. - Unclipped: cumulative (nested) classes. NDMC’s source layers are
cumulative — the D0 layer contains D1, and so on — and the archive
preserves that: each class layer is cleaned and dissolved on its own,
so a feature’s
usdm_classmeans this class or more severe. D1 lies within D0, D2 within D1 (up to hairline differences where a week’s geometry needed repair), and the features overlap. Draw them in class order (D0 first) for a correct map, or difference each class with the next more severe one to recover exclusive polygons. Class areas should therefore shrink from D0 to D4; any week where they do not is recorded indata/quality/nesting_unclipped.csv(the pipeline flags it but does not alter the authors’ polygons).
🗂 Directory Structure
This repository holds the pipeline code:
repository-root/
  ├── LICENSE                 # License for the repository (MIT)
  ├── README.Rmd              # Repository documentation (RMarkdown)
  ├── README.md               # Repository documentation (this file)
  ├── example-1.png           # Example figure using the data
  ├── usdm.R                  # Code to download, process, and archive USDM data
  └── usdm.Rproj              # RStudio project file
The BagIt-compliant archive of record lives on S3, served at https://data.sustainable-fsa.com/usdm/ (browse it in the archive listing):
usdm/                        # BagIt-compliant archive of USDM weekly data
  ├── bagit.txt               # BagIt version declaration
  ├── bag-info.txt            # Metadata about the bag archive
  ├── manifest-sha256.txt     # Checksums for integrity verification
  ├── usdm-manifest.json      # The directory listing of the USDM Archive
  └── data/
      ├── raw/                    # Downloaded clipped shapefiles (.zip)
      ├── raw_unclipped/          # Downloaded unclipped shapefiles (.zip, verbatim upstream files)
      ├── summary/                # Weekly summary XML files (shared by both products)
      ├── parquet/                # Cleaned clipped spatial data (.parquet)
      ├── parquet_unclipped/      # Cleaned unclipped spatial data (.parquet)
      ├── metadata/               # ISO 19115 metadata XML files (clipped)
      ├── metadata_unclipped/     # ISO 19115 metadata XML files (unclipped)
      └── quality/
        ├── geometry_validation.csv            # Log of geometry validation issues (clipped)
        ├── geometry_validation_unclipped.csv  # Log of geometry validation issues (unclipped)
        ├── nesting_unclipped.csv              # Weeks whose unclipped class areas do not shrink D0→D4 (classes not nested)
        └── raw_unclipped_sources.csv          # Provenance of unclipped raw files (source URL, upstream timestamp, size)
🧪 Analysis Pipeline
This R pipeline (usdm.R):
- Downloads weekly USDM shapefiles — both the clipped (“M”) and unclipped products — and XML summaries. Unclipped zips keep their verbatim upstream filenames and modification times, with provenance logged.
- Validates geometries using the S2 Geometry
Library via
sf::st_is_valid(), and logs invalid features for review. - Cleans and repairs shapefile geometries and converts them to the
GeoParquet format. Both products share the
same cleaning steps and output schema (
date,usdm_class); the clipped product is cleaned as one layer (exclusive classes), the unclipped product one class layer at a time (nested classes). - Writes ISO 19115-1 metadata for each weekly dataset in each
product using the
geometapackage. - Builds a BagIt structure with SHA-256 checksums to ensure archival integrity.
🔁 Weekly Updating
The pipeline automatically determines the most recent USDM date available and:
- Only downloads new or modified files.
- Uses file checksums to avoid unnecessary re-processing.
- Appends new validation issues to a persistent quality log.
Use the usdm() function to process a specific date, or
usdm_get_dates() to get all valid weekly dates.
🛠️ Dependencies
Key R packages used:
sf,terra,arrow,tidyverse,curlgeometafor ISO metadatadigestfor checksum computation
The script installs all required packages using the
pak package.
📍 Quick Start: Visualize a Weekly USDM Map in R
This snippet shows how to load a weekly GeoParquet file from the archive
and create a simple drought classification map using sf and ggplot2.
# Load required libraries
library(arrow)
library(sf)
library(ggplot2) # For plotting
library(tigris)  # For state boundaries
library(rmapshaper) # For innerlines function

## Get latest USDM data
latest <-
  jsonlite::fromJSON(
    "https://data.sustainable-fsa.com/usdm/usdm-manifest.json"
    )$path |>
  stringr::str_subset("^data/parquet/") |>
  max()
# e.g., [1] "data/parquet/USDM_2025-05-27.parquet"

# Read a weekly GeoParquet file as an sf object, straight from the archive
# Use tigris::shift_geometry to shift and rescale Alaska, Hawaii, and
# Puerto Rico in a US-wide sf object
usdm_sf <-
  paste0("https://data.sustainable-fsa.com/usdm/", latest) |>
  sf::read_sf() |>
  # tigris::shift_geometry only works consistently on POLYGON geometries
  sf::st_cast("POLYGON", warn = FALSE, do_split = TRUE) |> #
  tigris::shift_geometry()

states <-
  tigris::states(cb = TRUE,
                 resolution = "5m",
                 progress_bar = FALSE) |>
  dplyr::filter(
    !(NAME %in% c("Guam",
                  "American Samoa",
                  "United States Virgin Islands",
                  "Commonwealth of the Northern Mariana Islands"))
  ) |>
  sf::st_cast("POLYGON", warn = FALSE, do_split = TRUE) |>
  tigris::shift_geometry()

# Plot the map
ggplot(usdm_sf) +
  geom_sf(data = sf::st_union(states),
          fill = "grey80",
          color = NA) +
  geom_sf(aes(fill = usdm_class),
          color = "white",
          linewidth = 0.1) +
  geom_sf(data = rmapshaper::ms_innerlines(states),
          fill = NA,
          color = "white",
          linewidth = 0.2) +
  scale_fill_manual(
    values = c("#ffff00",
               "#fcd37f",
               "#ffaa00",
               "#e60000",
               "#730000"),
    drop = FALSE,
    name = "Drought\nClass") +
  labs(title = "US Drought Monitor",
       subtitle = format(usdm_sf$date[[1]], " %B %d, %Y")) +
  theme_void()
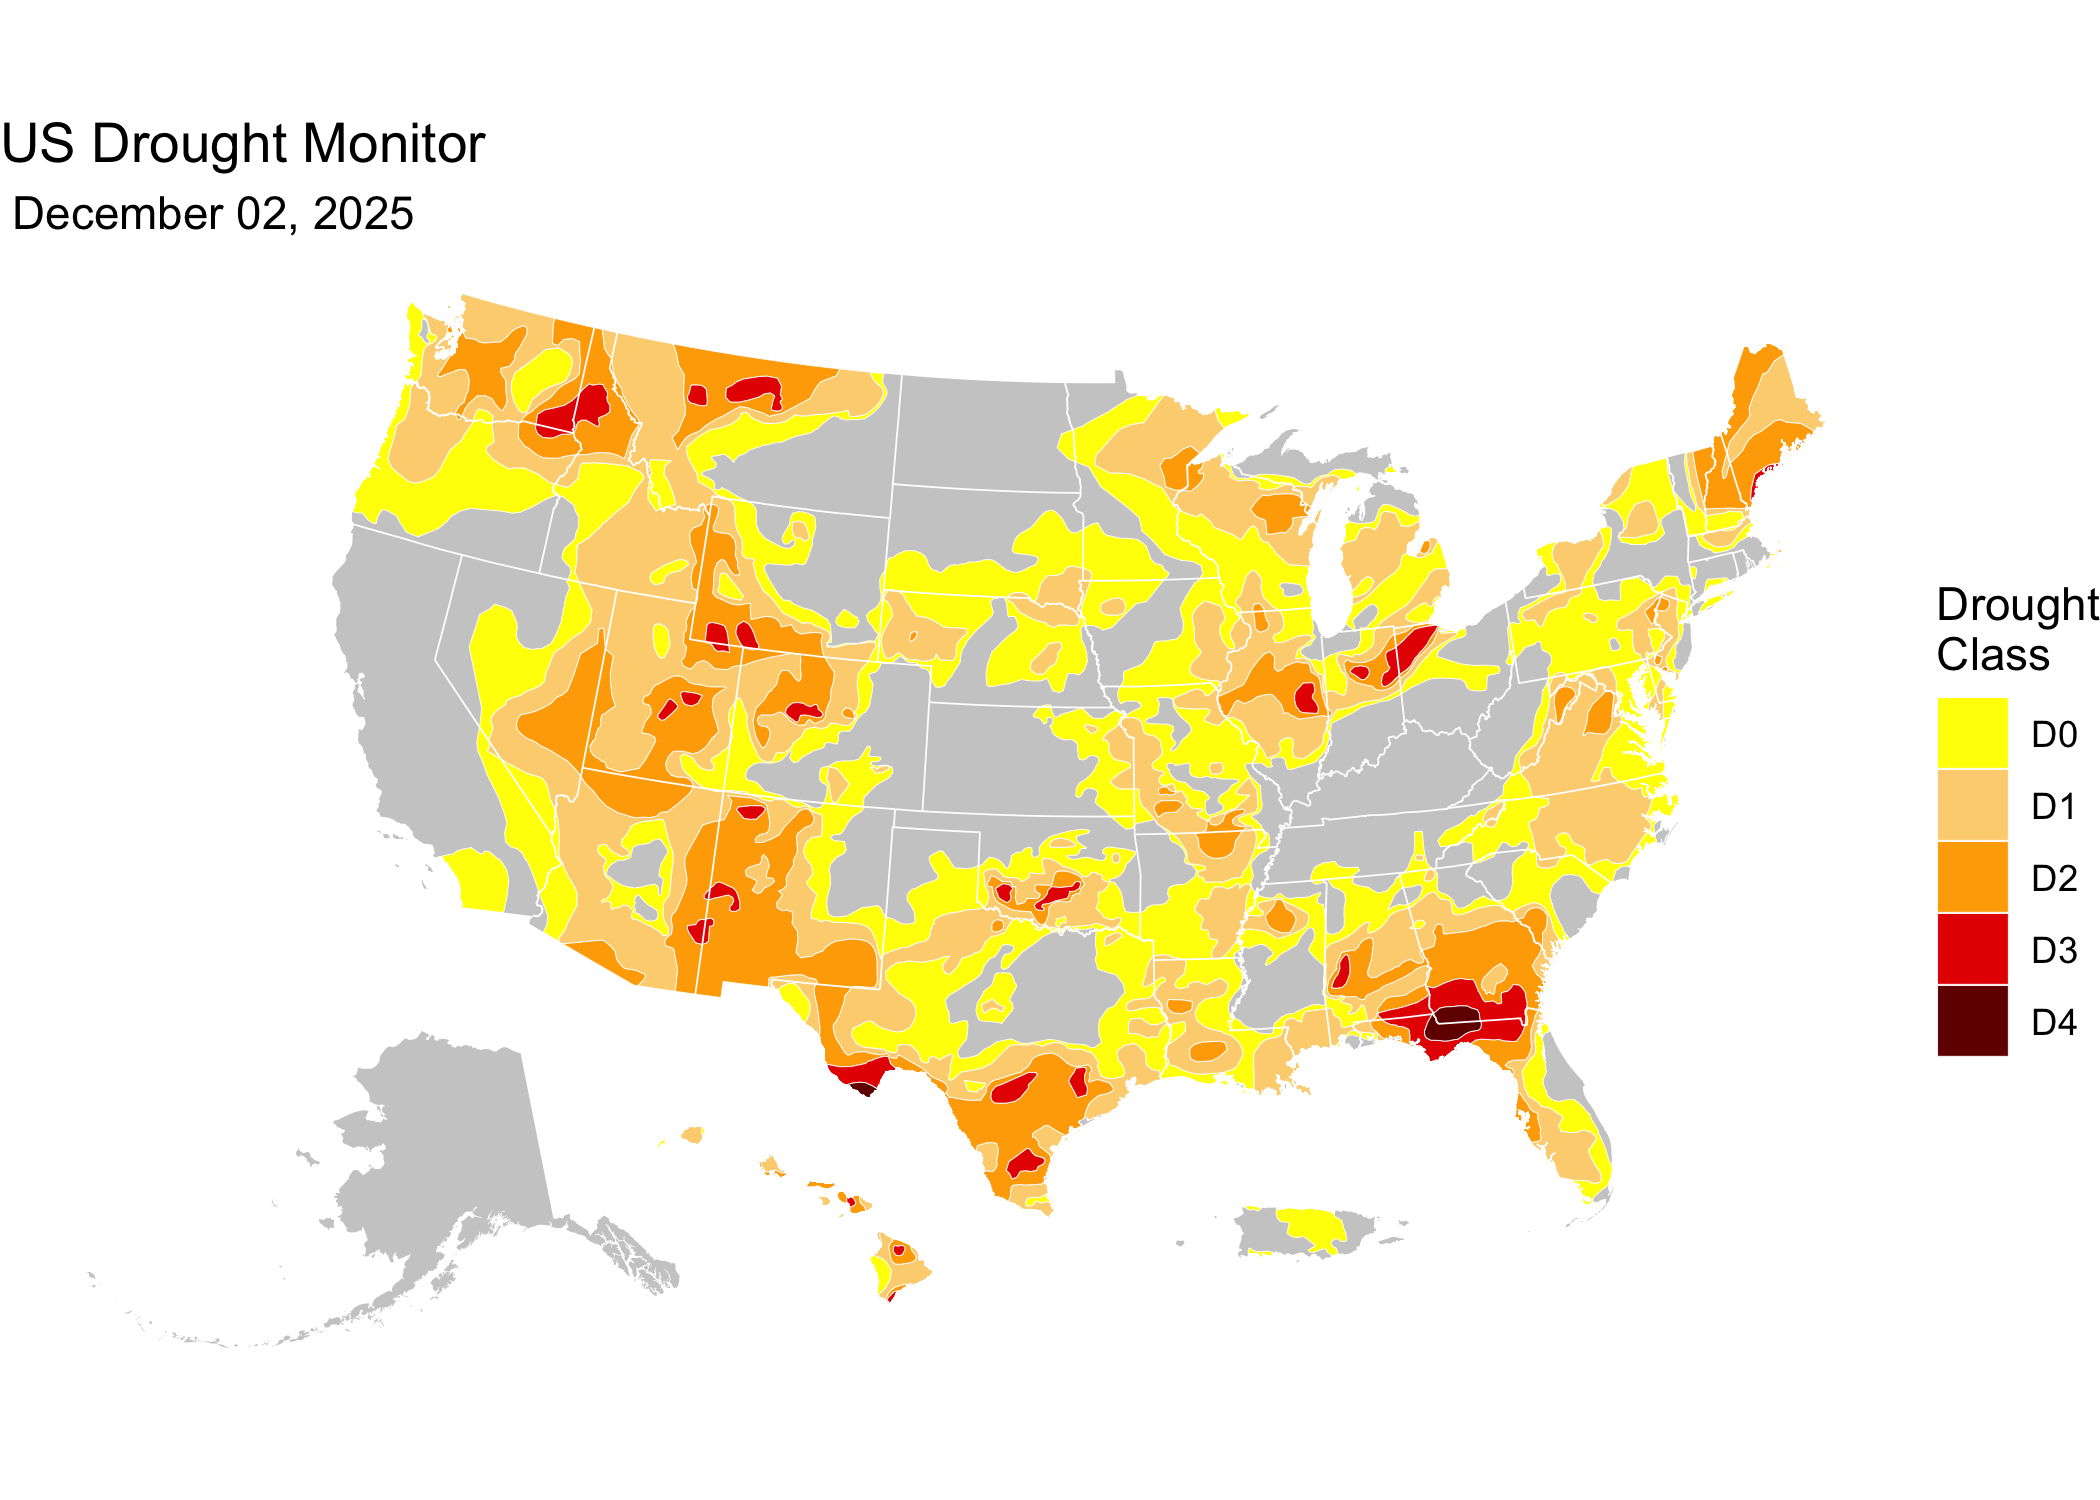
Latest USDM map date: October 13, 2026
To work with the unclipped product instead — the same weeks, but
with polygons that extend past the US coastline and nested classes
(each feature covers its class and all more severe classes) — swap the
manifest filter to the parquet_unclipped directory. Because the
features overlap, draw them in class order (D0 first, D4 last); to
recover mutually exclusive polygons, difference each class with the next
more severe one:
latest_unclipped <-
  jsonlite::fromJSON(
    "https://data.sustainable-fsa.com/usdm/usdm-manifest.json"
    )$path |>
  stringr::str_subset("^data/parquet_unclipped/") |>
  max()

usdm_unclipped_sf <-
  paste0("https://data.sustainable-fsa.com/usdm/", latest_unclipped) |>
  sf::read_sf() |>
  dplyr::arrange(usdm_class) # D0 first, so more severe classes draw on top

# Optional: exclusive classes, as in the clipped product. Difference each
# class with the next more severe one on the sphere (s2); a planar
# sf::st_difference can leave hairline self-crossings on a few weeks.
g <- sf::st_as_s2(usdm_unclipped_sf)
usdm_unclipped_exclusive <-
  usdm_unclipped_sf |>
  sf::st_set_geometry(
    sf::st_as_sfc(c(s2::s2_difference(g[-length(g)], g[-1]), g[length(g)])))
📝 Citation
If you use this data in published work, please cite:
National Drought Mitigation Center, USDA, and NOAA. US Drought Monitor Weekly Maps, January 4, 2000 – present. Curated and archived by R. Kyle Bocinsky, Montana Climate Office, University of Montana. Sustainable FSA project. Accessed YYYY-MM-DD. https://sustainable-fsa.com/usdm/
Machine-readable metadata are in CITATION.cff;
GitHub’s Cite this repository button (top right of the repo page)
renders it as APA or BibTeX.
Acknowledgment: This work is part of the Enhancing Sustainable Disaster Relief in FSA Programs project, supported by the USDA Office of the Chief Economist, Office of Energy and Environmental Policy, and the USDA Climate Hubs.
📄 License
- Raw USDM data (NDMC): Public Domain (17 USC § 105)
- Processed data & scripts: © R. Kyle Bocinsky, released under CC0 and MIT License as applicable
⚠️ Disclaimer
This dataset is archived for research and educational use only. The National Drought Mitigation Center hosts the US Drought Monitor. Please visit https://droughtmonitor.unl.edu.
👏 Acknowledgment
This project is part of:
Enhancing Sustainable Disaster Relief in FSA
Programs
Supported by USDA OCE/OEEP and USDA Climate Hubs
Prepared by the Montana Climate Office
📬 Contact
R. Kyle Bocinsky
Director of Climate Extension
Montana Climate Office
📧 kyle.bocinsky@umontana.edu
🌐 https://climate.umt.edu